LevelBasic
For proper use and maintenance of the detector it is important to read the instructions of the manual carefully. Many of the common problems can be prevented by following the advices from the manufacturer.
Before starting a trouble shooting procedure on the HPLC a few, sometimes very obvious, points specific for the detector should be checked first:
- Do detector/recorder and lamp have power?
- Is the (UV) lamp switched on?
- Are the connection cables between detector and recorder/integrator connected correctly?
- Is the attenuation of the detector and the recorder correct?
- Do the detector and recording system have the correct output and input voltage?
- Does the meter on the detector indicate a sufficient light transmission?
Since the detector volume is acting as a dynamic dead‑volume affecting the total peak broadening of the sample, not every detector can be connected to every ![]() column. The ratio peak volume to detector volume is very important.
column. The ratio peak volume to detector volume is very important.
The peak volume is mainly determined by:
- The volume of the column itself (depending on length and diameter)
- The capacity ratio k' of the eluting peak.
- Peak volumes can therefore vary widely for the type of column used (e.g typical column diameters vary between 1 and 50 mm and even 0.1 mm ID columns are used).
The following index shows a few column dimensions and their maximum allowable cell volume for the detector. The figures have been calculated for typical values, i.e:
L x ID 100 x 3.0 mm: N = 5000, flow = 0.6 ml/min, t0 = 1.52 min
L x ID 250 x 4.6 mm: N = 12500, flow = 1.4 ml/min, t0 = 3.80 min
| Column dimensions | Peak volume | Cell volume |
| 250 x 4.6 mm | 380 μl | 38 μl |
| 150 x 4.6 mm | 300 μl | 30 μl |
| 200 x 3.0 mm | 150 μl | 15 μl |
| 100 x 3.0 mm | 100 μl | 10 μl |
| 200 x 2.0 mm | 50 μl | 5 μl |
| 100 x 2.0 mm | 40 μl | 4 μl |
Actually one should define the total detector volume as the ![]() actual cell volume plus the volume of inlet tubing.
actual cell volume plus the volume of inlet tubing.
Obviously the connecting capillary ![]() between column and detector should be as short as possible:
between column and detector should be as short as possible:
5 ‑ 15 cm with an ID between 0.15 mm and 0.25 mm ID.
The total band broadening caused by injector, capillaries and detector can be determined by making a direct connection between injector and detector with a 0.15 or 0.25 mm ID capillary.
The injection of a inert component (e.g. toluene) will result in a peak. From the peak width and the flow rate the band broadening of the system in μl can be determined. In this way a comparison can be made between several detectors. Good systems should have a dead volume < 100 µl.
The time constant of an LC detector is related to the mean time of the input signal. If the time constant is short the signals are averaged less, but the baseline will show noise at higher sensitivities. A longer time constant will give less noise because the fluctuating input signals are averaged more strongly.
Thus the time constant is a sort of electronic noise filter. Actually it is a resistance‑capacity circuit. Often a choice can be made between several values like 0.5, 1.0 and 5.0 seconds. Although higher values result in a more stable baseline they can not always be used. Narrow and fast ![]() eluting peaks give smaller peak heights than they should. In normal practice a time constant of 0.5 or 1.0 seconds is usually appropriate.
eluting peaks give smaller peak heights than they should. In normal practice a time constant of 0.5 or 1.0 seconds is usually appropriate.
The detector response time is defined as the time the detector needs to change from 10% to 90% of the input. So it is the time the detector needs to respond to a change of signal.
- A good detector should respond quickly and promptly to changes of input signal. Its response time is small.
- A higher response time gives rise to small and broad peaks which in itself results in less resolution.
- As a general guideline one could say that the maximum response time should be 1/5 of the standard deviation (σt) of the peak (in time units). Typical default value is set at 500 msec (0.5 s).
Contamination is usually the result of the presence of impurities in the mobile phase.
- Impurities in the sample generally have little effect on the detector because the concentrations are fairly low.
- Most of the impurities are retained in the guard column.
- Large concentrations of impurities in the mobile phase can also result in blockages in the detector.
- The mobile phase can be the source of blockages as well as the packing material escaping from the column which can block the detector.
A badly functioning cell can be treated in several ways:
- Rinsing
Many of the contaminating components with varying solubility can be removed by rinsing with solvents like methanol, THF, dichloromethane. - Backflush
If this procedure is not sufficient the following methods could be tried: Backflush
Especially blockages might be solved by backflush. However the pressure over the detector cell has to be checked because many detectors cannot withstand pressures over 0.5 mPa (RI‑detectors). - Rinsing with solvents.
If the cell is disconnected, solvents like methanol, can be used followed by rinsing with water. It must be possible to look right through the cell when filled with a pure liquid. If not, than take action like the next point. - Dismantling
Dismantle the entire cell and clean it with solvents and tissue. The quarts window in particular can be cleaned thoroughly with this method. Take care not to put too much strain on the cell when it is mounted, otherwise the window might break.
The ![]() noise level of a detector is often used to describe the minimum detectable quantity of a certain compound. A
noise level of a detector is often used to describe the minimum detectable quantity of a certain compound. A ![]() detection limit of twice the noise level is usually the defined limit, but for quantitative purposes 3 or 4 x the noise level is a more realistic value.
detection limit of twice the noise level is usually the defined limit, but for quantitative purposes 3 or 4 x the noise level is a more realistic value.
Good detectors have a noise level of approx. 1 to 2 x 10‑5 AUfs (Adsorption Units full scale).
Noise can have a high or a low frequency:
- Low frequency noise is called "wander" and is often due to eluting impurities, pump beats and the on and off switching of equipment on the same electrical circuit (gives also spikes). Irregular flow and a poor gradient formation can also be the cause of low frequency noise.
- High frequency noise can originate from:
- Electronics
- Pump fluctuations
- Air bubble in the cell
- Contamination of the cell
- Old lamp
- High frequency signals from radios and transmittors
- Fluctuations in electrical power supply
- Too low a frequency for the eluent
Noisy baseline profiles 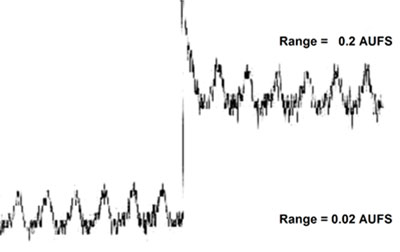
![]() Cause?
Cause?
Noise can never be eliminated completely, but a few measures can be taken to reduce it as much as possible.
The pump and the mobile phase are often the cause of noise. The necessity of working with pure eluents has been mentioned a few times but also applies to a well functioning detector.
The influence of the pump or the mobile phase (impurities) on the amount of noise can be checked by switching off the pump, disconnecting the column and flush the detector cell manually with pure water and methanol. When no significant difference can be observed in noise level between a running pump and a switched off pump the source of the noise is in the detector cell itself or in the data system.
The UV‑cut off for a number of important HPLC‑solvents is described under the mobile phase. Below these wavelengths the solvent is usually not transparent enough to be used in combination with a UV‑detector. Sometimes it is possible to operate just below this limit but only at the expense of an increase in noise level.
Poor mixing in gradient systems usually leads to drift or a wave pattern baseline but can also result in an increased noise level. In the example below the waves in the baseline were not related to the flowrate or mixing of the mobile solvent components (methanol and water) in the gradient pump. After consulting the service engineer the problem turned out to be a malfuntion of the power supply for the lamp in the UV detector.
Baseline fluctuations, UV 254 nm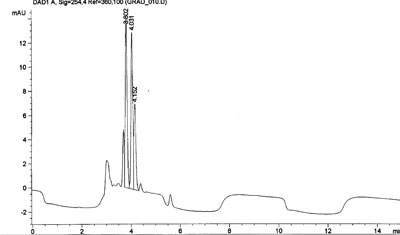 Baseline fluctuations, reduced flow
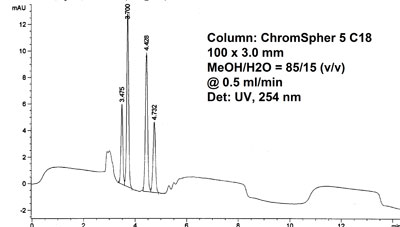
Long term baseline fluctuations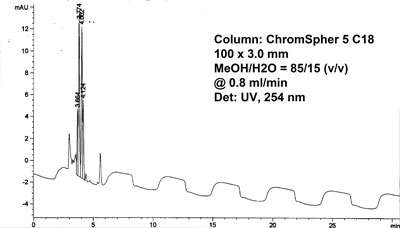
UV-detector lamp voltage plot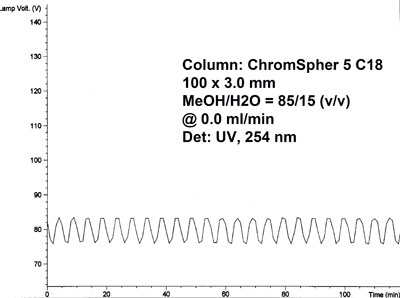
The response factor and sensitivity of the same or a different detector can sometimes differ from previous analyses. One of the reasons could be a deviation from the actual wavelength going through the cell and the set value. The mirrors, the monochromator or the lenses could be dislodged as a result of, for example, bumping or shaking.
A small difference in wavelength (1 or 2 nm) can have a significant influence on the UV‑adsorption of many compounds. As a result peak heights will differ widely. Some detectors have the built‑in option to change the position of the cell. In other cases the detector has to be serviced or recalibrated with the aid of the manual.
Optimal UV wavelength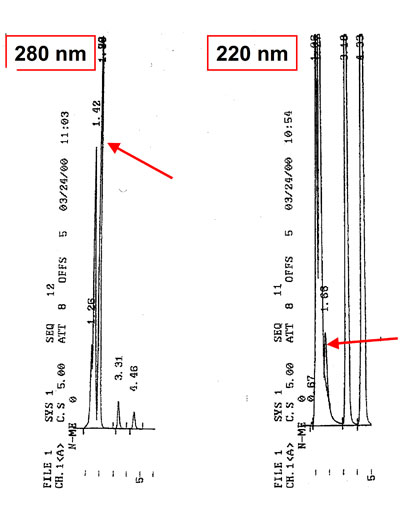
Different response factors between UV-detectors 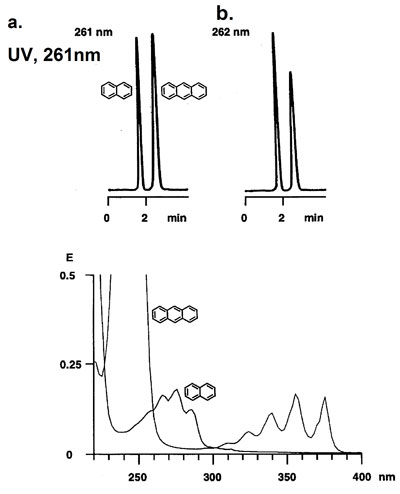
A gradual change in baseline level can have several causes:
- a change in the equilibrium inside the column
- a change in temperature
- a change in flow
- gradient elution
- air bubble or leaking flow cell
- bleeding of dirt or liquid from manometers etc.
- warming‑up of the detector
Drift on the baseline can be used to observe the progress of equilibration in the column. If this equilibrium is disturbed, for example with gradient elution, the baseline will shift if the new mixture of solvent has a different UV absorbance. Some data systems are capable of memorizing this drift (from a blank run) and subtract this signal during the actual analysis from the total signal.
The stability of the detector is greatly affected by the temperature. The detector should therefore be stabilized at the required temperature before running the analysis. In addition, external factors can play a part such as lab‑temperature, direct sunlight, draughts etc.
The noise level depends on both the stability of the UV‑lamp with regard to wavelength and light intensity. The noise level can be reduced by applying a some what higher ![]() column temperature than the ambient temperature, e.g. 30 ‑ 35°C in combination with carefully insulated connecting tubing.
column temperature than the ambient temperature, e.g. 30 ‑ 35°C in combination with carefully insulated connecting tubing.
It is important to adjust both the zero‑adjustment of the detector and the data system to each other. After warming‑up the detector the flow‑cell can be flushed with eluent coming from an equilibrated column.
If it is not possible to get the adequate zero level, check the following possibilities:
- Air‑bubble in the detector cell
- Contaminated measuring or reference cell
- Leaking flow cell
- Impure eluent
- Eluent not compatible at the set wavelength
- Wrong wavelength
- No column equilibrium
- Detector sensitivity too high/input voltage incorrect